
Scroll down or click these links for appendixes on CHICAGO MORTALITY TRENDS and WEATHER RECORDS; and SOURCE NOTES.
THIS MONTH—JULY 2020—WAS THE 25TH ANNIVERSARY OF CHICAGO’S MOST NOTORIOUS HEAT WAVE, which killed an estimated 700 people during a scorching week in 1995. While that tragedy is well documented, a similar catastrophe from earlier in the city’s history is largely forgotten: In the summer of 1916, several hundred people died during one of the hottest stretches of weather Chicago had ever seen. Depending on how you calculate the death toll, it may have been more than a thousand.
On July 29, 1916, the telephone rang over and over again at the desk of Charles Forsberg, a clerk in the Cook County coroner’s office.
“It kept ringing constantly for nearly two hours at one stretch, as the doctors turned in report after report of deaths caused by the heat,” Forsberg told the Chicago Daily News. “I felt myself beginning to grow faint as I sat at the instrument and sank to the floor. The next thing I knew other clerks were throwing water over my face and head.”1
Meanwhile, dozens of patients were arriving at Cook County Hospital suffering from heat prostration. Most of them were comatose. “I have touched patients whose skins felt like hot roast,” said Dr. Karl Meyer, the hospital’s medical warden.2
Even before the worst of the heat struck Chicago, July 1916 had already been hot and unusually sunny. From July 1 through July 25, temperatures averaged 3.9 degrees above normal.
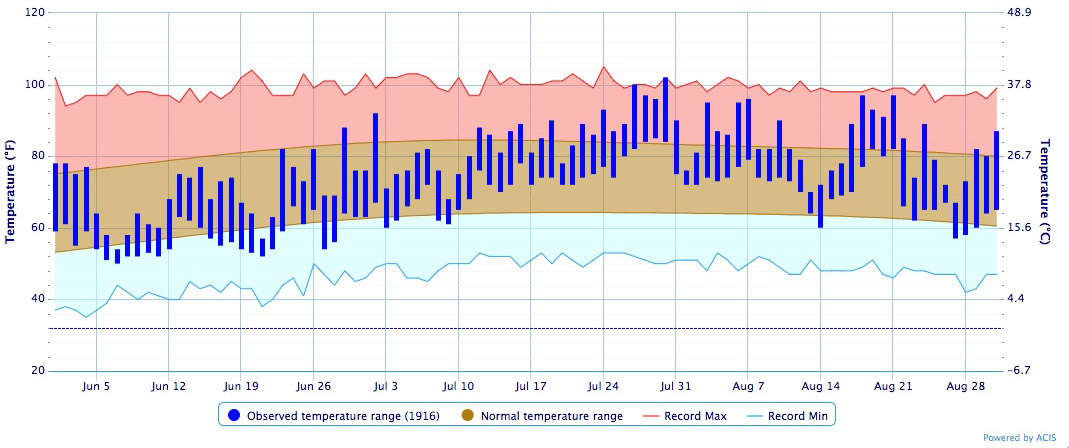
Not a single cloud was seen blocking the sun in the skies over the Loop from July 3 through July 11, as meteorologists recorded nine straight days with 100 percent of possible sunshine, setting a new all-time record for Chicago. And it didn’t rain much that July—only 2.2 inches, or 61 percent of the usual rainfall.3
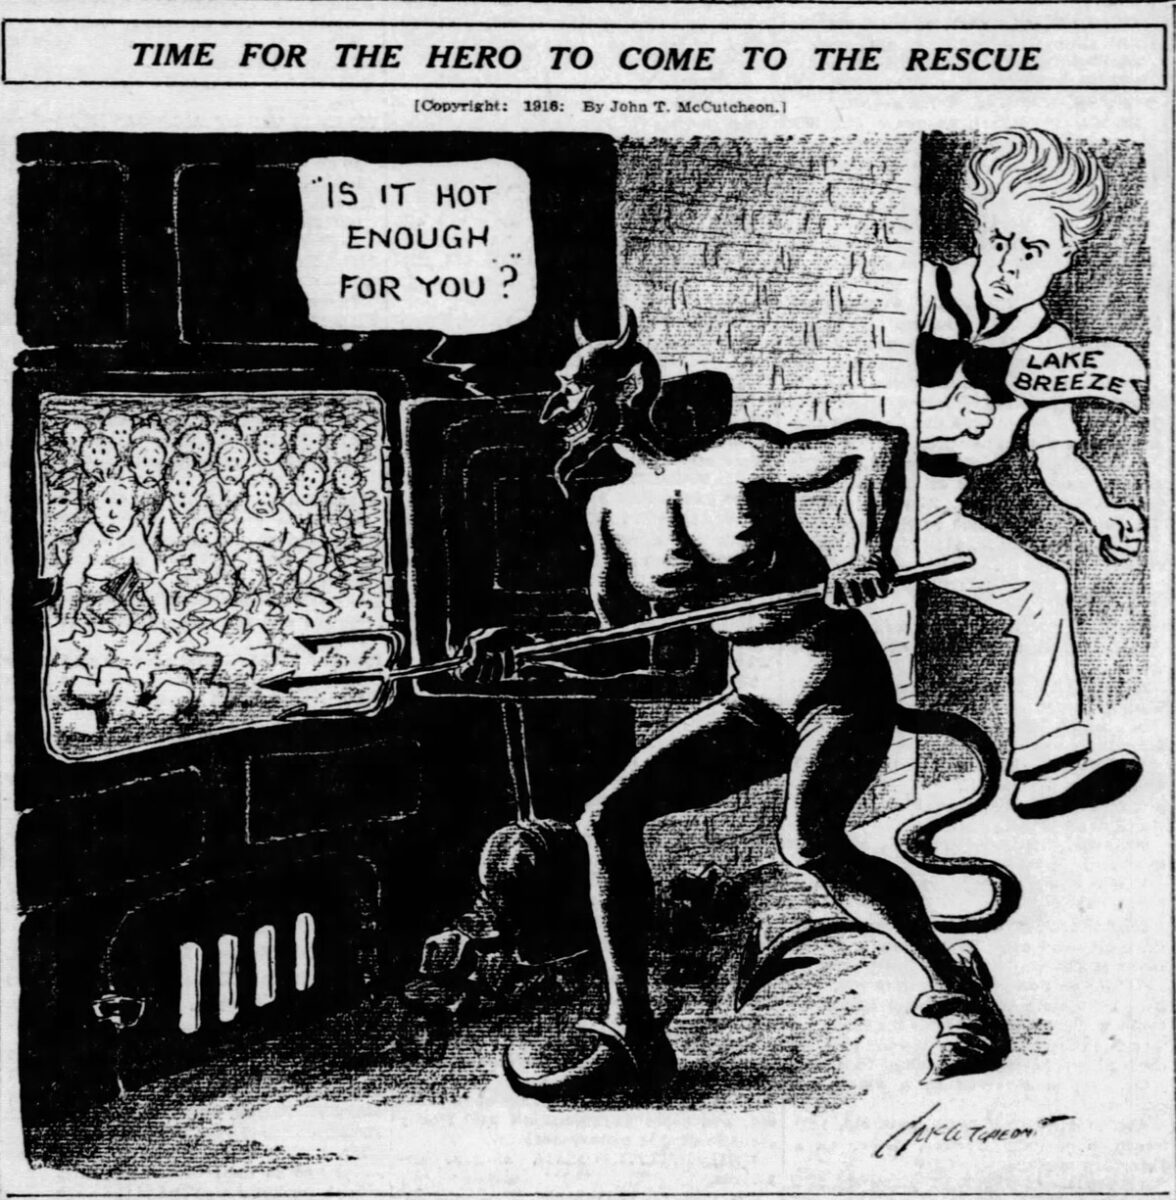
A wall of hot winds and tropical humidity, which the weather experts called a “Bermuda High,” swept up from the Atlantic Ocean across the continent.4 Although Lake Michigan often helps to cool off Chicago during warm weather, that didn’t happen during this heat wave.
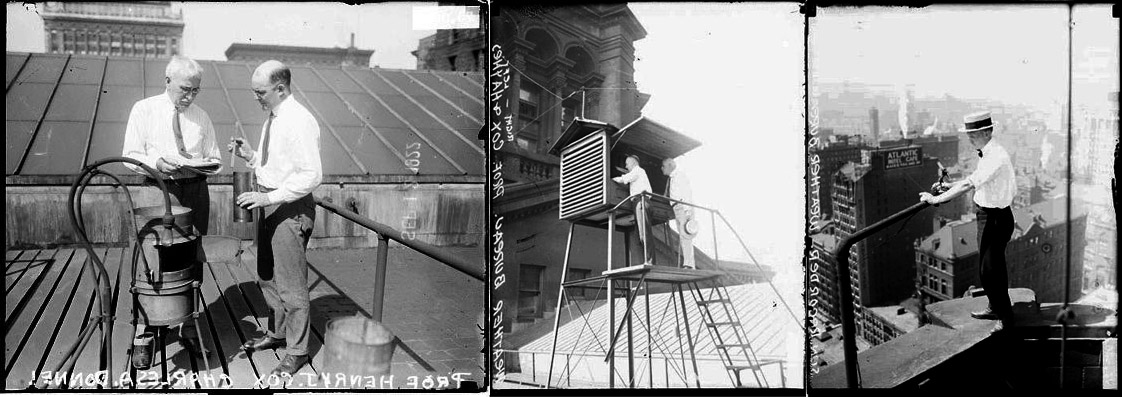
“The city has suffered for want of lake breezes,” Charles L. Mitchell, a forecaster at the federal Weather Bureau’s observatory in the Loop, told the Daily News. “Winds have been mostly from the south and southwest, and our advantageous position by the lake has not operated in our favor.” 5
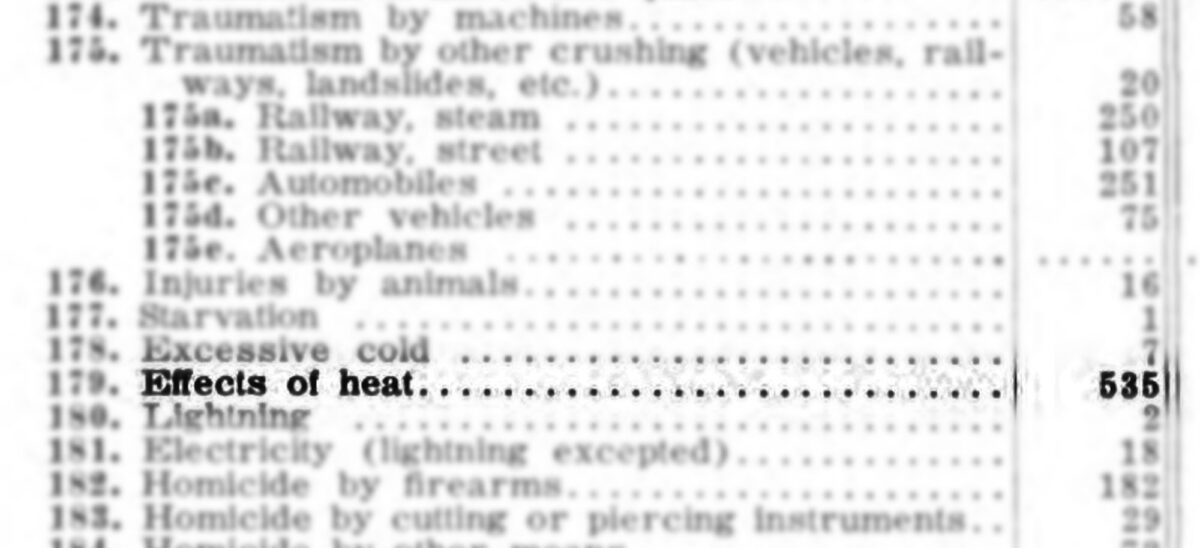
In mid-July, newspapers began reporting about people dying from the heat. 6 City health officials counted seven such deaths during the week of July 16 to 22.7 In that one week, Chicago surpassed its tally for 1915, when only four people had died from “effects of heat” during the entire year.8
Another stretch of days with 100 percent sunshine began on July 21, 1916.3
“PEOPLE OUGHT NOT STAY INDOORS,” warned the city librarian, Henry E. Legler.9 He had good reason for offering that advice—Chicago’s indoor spaces were stiflingly hot.
Air conditioning would not become common in American homes until decades later,10 and only a few buildings in Chicago had effective cooling systems in 1916: Meatpacking companies near the Union Stock Yard had coolers where beef was stored at a temperature of 38 degrees.11 And hotels in the Loop cooled their restaurants with early versions of air-conditioning technology, using “washed ice air” and carbon dioxide coils,12 and keeping cafés at 65 or 70 degrees.
When the Cook County coroner urged hotels to relax their rule requiring men to wear coats in restaurants during the heat wave, hotel managers said, “Oh, they would be chilly with their coats off.” But the Daily News reported that hotels did give special permission for men to remove their coats inside the less fancy grill rooms and cafés where the presence of women was forbidden.1
How could you cool off during a heat wave in 1916? City health officials offered advice to Chicagoans: “If you feel dizzy, weak and exhausted, seek the shade, lie down and wet your head. Drink buttermilk and lemonade. Drink plenty of water. It will make you sweat and help to keep you cool.”13
Chicagoans might get some relief by using electric fans, which were becoming more common in the early 20th century.14 Marshall Field & Co. was selling an eight-inch oscillating fan for $10.50 (adjusted for inflation, $250 in today’s dollars). “Make possible the instant production, day and night, of a cooling breeze,” an advertisement for the Loop department store promised.15
During the 1916 heat wave, many Chicago stores sold out of electric fans.4
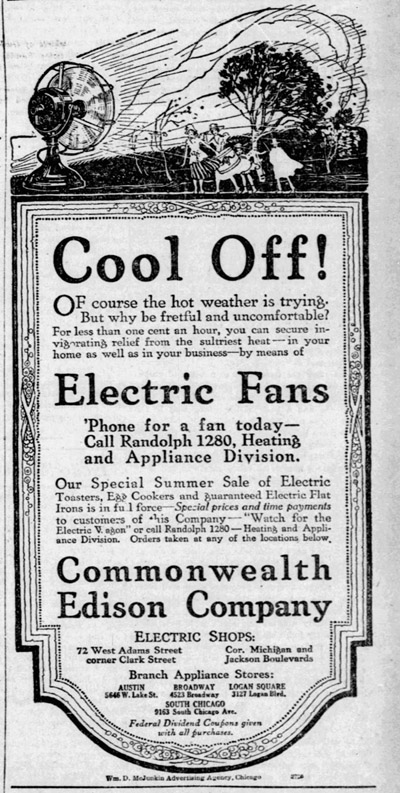
But electricity itself was still something of a novelty—only a third of Chicago families had electrical power in their homes, according to historian Harold L. Platt’s book The Electric City.16 As the Chicago Daily Tribune noted, “ice and electric fans were little known” in the city’s “congested districts.”4
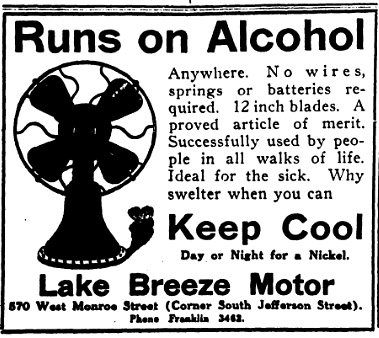
People without electrical power in their homes might buy fans with motors powered by alcohol or gas17 A Chicago company called Lake Breeze Motor was selling one such device. “Runs on Alcohol,” an advertisement explained. “Why swelter when you can Keep Cool Day or Night for a Nickel.”18
Buying blocks of ice was another way of cooling off. “Don’t forget that ice is salvation to babies,” the Chicago Department of Health declared—a piece of advice published in the Chicago Defender.19
The city had 2,771 licensed ice dealers in 1916, many of them using horse-drawn wagons. Chicago—with a population of 2.5 million people—used 2 million tons of ice a year. More than half of it was cut from 50 lakes and rivers in northern Illinois and southern Wisconsin during the winter and then stored until summer, but an increasing amount came from about 30 local ice-manufacturing plants.20
During the 1916 heat wave, there weren’t enough drivers to deliver ice to everyone who wanted it.21 And the horses pulling ice wagons were collapsing from the heat—as many as 200 reportedly died in just one day.22
Describing the West Side’s densely populated immigrant neighborhoods, the Tribune observed: “In many cases the poorer homes have no place to keep more than twenty-five or fifty pounds of ice at a time and this supply is soon exhausted.”23
In the South Chicago neighborhood, police arrested 12-year-old Johnnie Kurtz when he picked up a piece of ice in the Baltimore and Ohio Railroad yards. According to the Tribune, Johnnie’s mother had been longing for some ice to cool off her eight children in the family’s small apartment at 3208 East 93rd Street.24
Lake Michigan’s waters were another source of relief, and Chicagoans flocked to the beaches. After several people drowned, local officials hurried to train more lifeguards.25
Drowning was a common peril in Chicago during that era: An average of 131 people died each year in accidental drownings from 1900 to 1920, plus an average of 17 drownings ruled as suicides. (These figures don’t include the 812 people who perished when the Eastland excursion ship capsized in the Chicago River in 1915.)26
In comparison, 25 people drowned off Chicago’s lakefront in 2019, according to the Great Lakes Surf Rescue Project.27
THE TEMPERATURE INCHED UP PAST 80 between 2 and 3 a.m. on Wednesday, July 26, 1916. It was not an extraordinarily hot day, with a high of just 89 degrees. But as night fell, the mercury in thermometers barely budged. It was still 84 degrees at midnight.
That was the beginning of a five-day stretch when the temperature never dropped below that 80-degree mark on the thermometer, depriving Chicagoans of any chance to cool off at nighttime.
Up until this moment in history, Chicago had never experienced a day when the thermometer stayed above 81.7 degrees during an entire 24-hour period. The city broke that record on Thursday, July 27, 1916, when the temperature never got any lower than 82. That was the reading on the government’s thermometer at 6 a.m.3
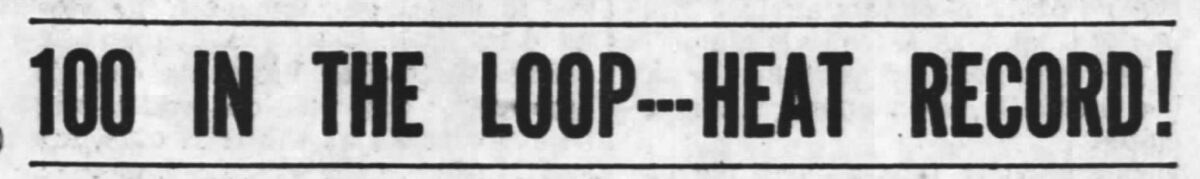
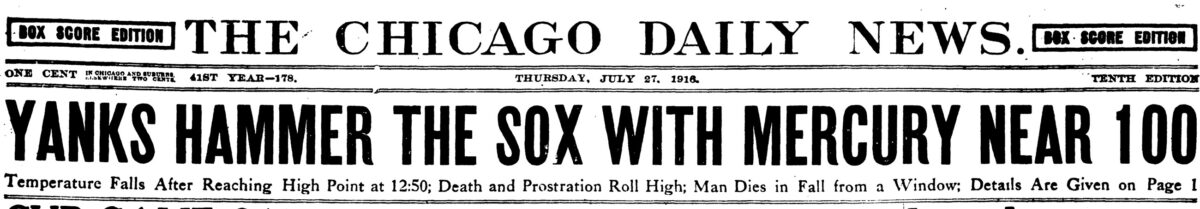
It was another cloudless day, and the wind was blowing five miles an hour from the northeast. “For a day the name ‘Windy City’ was a lie,” the Tribune remarked. “There wasn’t even enough breeze to put the wave in heat wave, so the torridity just stuck.”28 The temperature reached a high of 100 at 12:48 p.m. before going back down to 99 degrees eight minutes later.
The U.S. government’s official thermometer was in the top floor of the Chicago Federal Building, a 297-foot-high structure in the block bounded by Adams, Clark, and Dearborn Streets and Jackson Boulevard—now the site of the Chicago Federal Center plaza.29
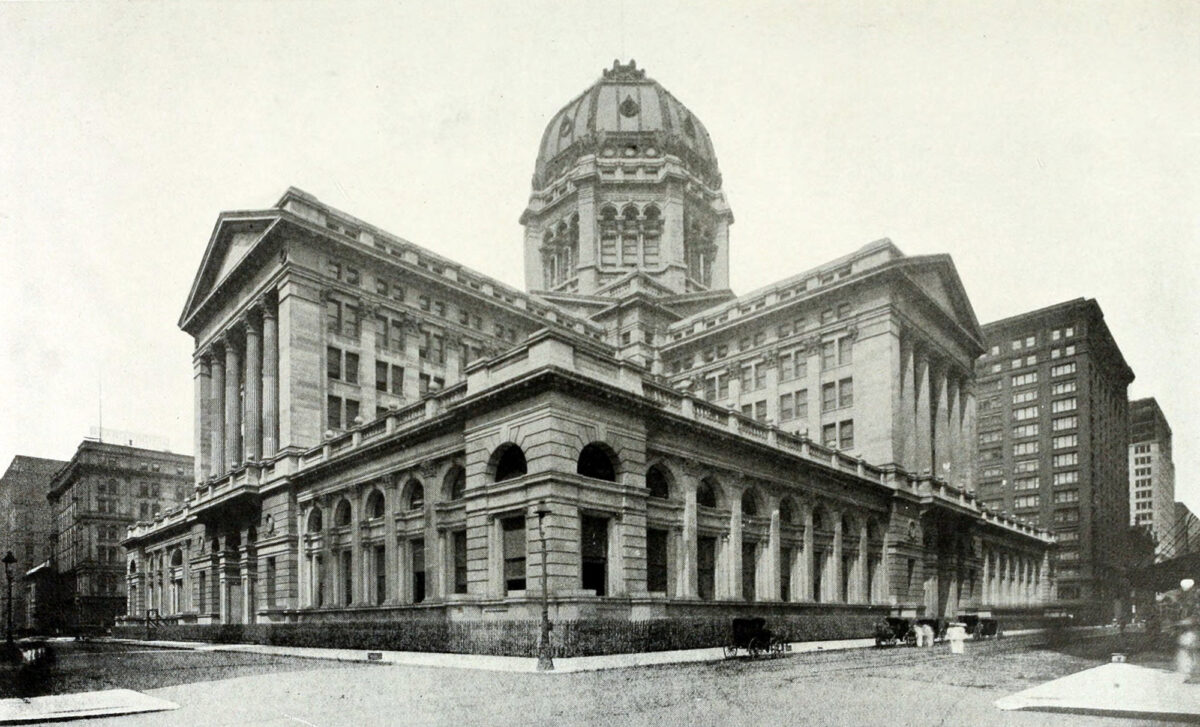
But it was hotter on the streets below. When the official reading up in the tower was 100, a thermometer on the street registered 103.4 An office boy tried to gauge the heat in a sunny spot on Halsted Street, but his thermometer only went up to 110—and the temperature seemed to be higher. Some people in outlying neighborhoods said their thermometers showed it was as hot as 125 in the sun.30
THE TRIBUNE AND DAILY NEWS BEGAN PUBLISHING DAILY LISTS OF PEOPLE WHO’D DIED FROM THE HEAT. Most were found dead in their homes or died in hospitals.
Charles Hall, a 63-year-old retired carpenter, dropped dead while he was watching a ballgame on the Northwest Side.31 George Nagler, a 58-year-old railroad section hand who lived at 10810 South Torrence Avenue, was “overcome in the street.”
W.J. Russell, a 37-year-old mail carrier who lived at 4324 West Monroe Street, collapsed in a street near his home.32 J.W. Hicks, an 82-year-old resident of St. Johns, Michigan, died as he was sitting in a chair and waiting for a train in the Illinois Central Railroad’s station at the south end of Grant Park.33
During July, 158 patients suffering from sunstroke and heat exhaustion were admitted to Cook County Hospital, most of them during the month’s final days. Some of them had felt sick for days, experiencing headaches and dizziness. Others hadn’t noticed any symptoms until an attack hit them instantaneously. A medical journal article described the experiences of several patients who ended up at Cook County Hospital:
“One teamster left his wagon to get a drink of water; he felt perfectly well when he left his seat; as he stooped to drink from the fountain, he felt himself slipping, and remembered nothing further until he awoke in the hospital. He had a temperature of 110° on admittance.
“A laborer who also had a temperature of 110° stated that he was cleaning street cars at a terminal barn, and that he was just leaving one car to enter another when he lost consciousness. He insisted that he knew nothing after leaving the car, and that he felt perfectly well up to that moment, and had no unpleasant sensations then.
“A number of patients who had severe headaches and who were dizzy went walking in effort to find relief, and dropped in the streets; many were lying in bed when they lost consciousness.”
Out of those 158 patients at the county hospital, 129 were in comas when they were admitted. Thirty-eight had body temperatures of 110 degrees or higher—some as high as 114.
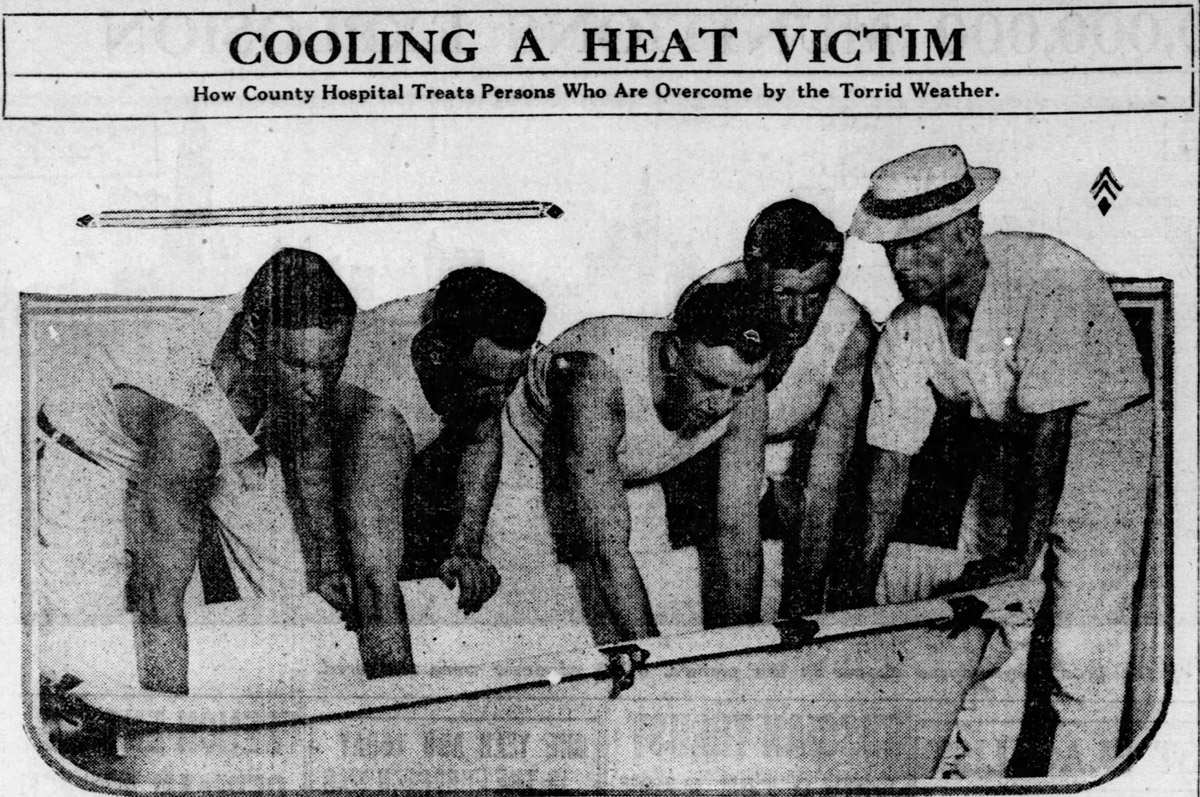
“All patients with a temperature of 103° or over were immediately placed in a tub of tap water, the level of which was just high enough to cover the body except the head, which was supported in a hammock packed with ice,” physicians Harry Gauss and Karl Meyer wrote in the American Journal of the Medical Sciences.
“Vigorous friction was applied to the entire body by four or more persons; ice was freely added to the water, the friction being constantly maintained; the temperature was taken rectally every minute. When the temperature reached 102° the patient was removed from the bath, wrapped in sheets or blankets, and returned to the ward.”
When patients emerged from their heat-wave comas, some of them were unable to speak, making only “inarticulate, guttural, meaningless sounds.” Others hallucinated: “one patient was afraid that his wife and daughter were trying to kill him, and another asked who was constantly calling his name.”
In spite of all the hospital’s efforts, 70 of those 158 patients died.34
MEANWHILE, CITY HEALTH AUTHORITIES REPORTED A SURGE IN INFANT DEATHS—including 70 in just one day.35
The official cause of death was usually diarrhea, but Dr. William Augustus Evans, a former Chicago health commissioner, blamed the heat wave. “The large number of babies dying in the last few days is a result of the heat and humidity,” he wrote. “When a baby’s bowels get out of order in hot weather the mother should stop feeding the child at once and send for a doctor.”36
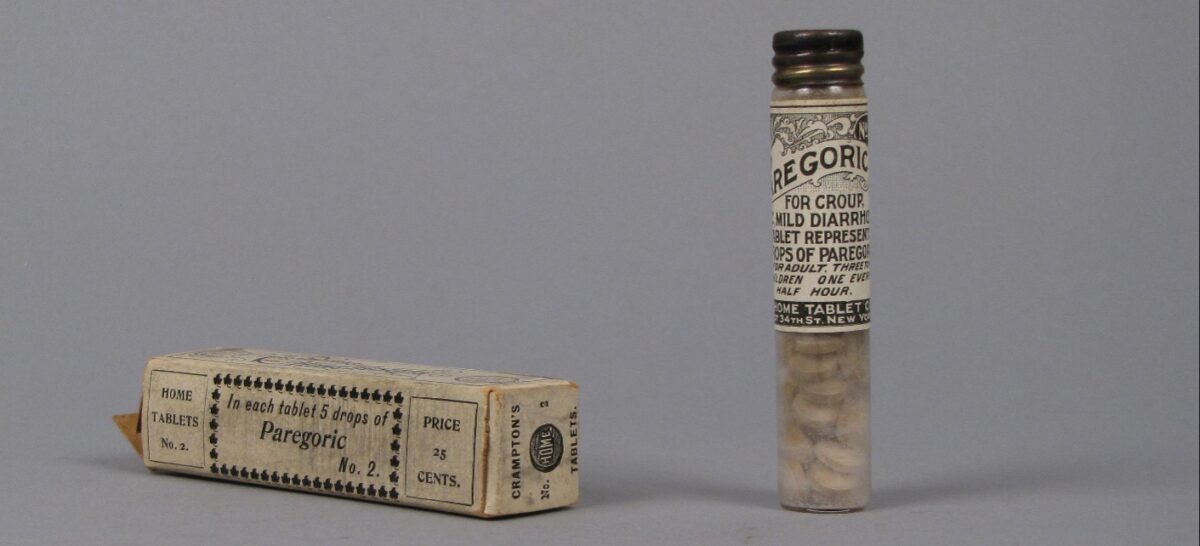
Chicago’s health commissioner, Dr. John Dill Robertson, said parents made the problem worse by treating babies with syrups and paregoric (or camphorated tincture of opium).
“Paregoric has killed more babies than the hot summer sun,” Robertson said. “The most common cause of death in infants is diarrhea, and it is frequently the administering of soothing sirups [sic] or home remedies that makes the disease fatal. The ‘dope’ quiets the child but holds the poison that caused the illness in the system.”37
(A Chicago Reader story by Jeff Nichols profiles Robertson, known as a crackpot who believed bathing was an unhealthy habit that encouraged infectious diseases.)38
“Hot weather is killing scores of infants in Chicago,” the Daily News wrote. “The crowded districts are full of tiny children gasping for breath.”
The newspaper urged parents to bring ailing infants to the Daily News Fresh Air Fund Sanitarium, on the lakeshore near Fullerton Avenue. In addition to free medical care and advice, “Your baby can get a day’s relief from the heat resting in a hammock in the pavilion by the lake,” the newspaper said.39 (The shelter was replaced by a permanent structure in 1920, which is now the Chicago Park District’s Theater on the Lake.)
Robertson said more than 60 percent of the infant deaths occurred in “foreign settlements and congested neighborhoods.”37
Back of the Yards, the immigrant neighborhood near the stockyards, was one of the areas hit hardest by infant mortality, according to the Daily News.40
Meanwhile, the Tribune reported: “In the congested districts of the west side hundreds of babies are at the point of death from the heat. Pure milk and ice are needed to keep them alive.”23
According to the Tribune, health officials said that 90 percent of the deaths were caused by “Insanitary alleys, lack of proper screening from flies, too much ice water, and failure of parents to give the children warm water or lemonade at frequent intervals during the day.”41
IT OFTEN SOUNDED AS IF HEALTH AUTHORITIES AND NEWSPAPERS WERE BLAMING CHICAGO’S POOR IMMIGRANTS for the difficulties that they faced—a foreshadowing of what happened in 1995.
In his book Heat Wave: A Social Autopsy of Disaster in Chicago, sociologist Eric Klinenberg describes how Mayor Richard M. Daley and other city officials sometimes directed blame at victims during the 1995 heat wave. “We’re talking about people who die because they neglect themselves,” said Daniel Alvarez, who was the city’s human services commissioner.42
During the 1916 heat wave, the Daily News quoted Dr. S.W. Menclewski, a physician who served patients in the Back of the Yards neighborhood.
“And underlying every other element that enters into the frightful health conditions of that neighborhood is the ignorance of the mothers,” said Menclewski, a Polish immigrant. “They do not know how to feed their children. They do not know how to keep them clean. They ‘dope’ them with soothing sirups, let the milk and food spoil for lack of care as much as for lack of conveniences, and call the doctor only at the last minute. Seventy per cent of the baby cases in that quarter are hopeless when the doctor arrives.”43
Gauss and Meyer, the doctors at Cook County Hospital, believed that alcoholism played a role in many of the heat wave’s deaths.
When they questioned 25 patients suffering from the heat, 23 said they’d drunk beer during the 24 hours before they got sick, in amounts varying from one glass to one gallon, and some had also drunk hard liquor. All but one of those patients had a habit of drinking daily. And the doctors reported that some of the other patients—the unconscious ones—had a strong odor of alcohol.34
“I should say 99 per cent of our cases were directly or indirectly due to alcohol,” Dr. Meyer told the Tribune. “Beer and booze have two effects: They increase the bodily supply of heat and they lower the powers of resistance. The heat regulating center in the brain becomes deranged and the almost inevitable result is prostration…
“And if it weren’t for alcohol they probably wouldn’t have been here. If alcohol was taken out of the world, I believe the number of cases of all kinds at the county hospital would be reduced by half. After what I’ve seen in this hospital I don’t understand how any doctor can sanction its use.”2
Gauss and Meyer raised a valid point about the dangers of consuming alcohol during very hot weather, but they also seemed to be engaging in another sort of victim-blaming.
Meyer’s commentary reflected a debate that was raging in the United States at the time: Should alcohol be outlawed? The following year, the U.S. Senate proposed the 18th Amendment, prohibiting “the manufacture, sale, or transportation of intoxicating liquors.” After it was ratified, the Prohibition Era began in 1920.
ON FRIDAY, JULY 28, 1916, THE LOW WAS 84—breaking that record for the highest low temperature, which Chicago had set just one day earlier. The high was 97. The relative humidity hit its highest point of the week, 66, which may have made it feel even hotter than the day before.
The wind was blowing six miles an hour from the east, as it would for the next three days. Despite blowing across Lake Michigan’s water, it didn’t seem to bring any relief.3
The heat took a toll on Chicago’s workers. Those 158 patients admitted to Cook County Hospital included 85 laborers, 12 teamsters, and eight carpenters, along with firemen, peddlers, laundry workers, housewives, cooks, and clerks.34
The newspapers reported on laborers dying, such as John O’Toole, 29, of 10 West 57th Street, who was driving a wagon at 15th and Canal Streets in the South Loop when he fell off and died.44
John Taylor, a 58-year-old teamster who lived at 3759 South California Avenue, died when he was overcome by heat while working in a coal yard.32
Ignatz Tarcinski, 29, of 2312 Lister Avenue, collapsed in an International Harvester Company factory and died in a hospital a day later.45
Temperatures soared to 150 degrees inside the Illinois Steel Company’s plant in South Chicago.5 Several steel mills closed when thousands of employees walked off the job.28
Around the city, construction sites were abandoned by carpenters and other workers. “I could not blame them,” said Charles W. Secord, a general contractor. “… they quit when the temperature reached 118 degrees.”40
Swooning in rapid succession, 30 women and girls fainted while working at counters inside the Fair, a department store at the northwest corner of State and Adams Streets. Employees complained that the Fair didn’t bother to cool off its own workers with electric fans, even as it sold the devices to customers.46
Many stores and banks in the Loop let employees go home early. “They invariably go straight home and get off their high collars and starched shirts,” said F.J. Bridges, general manager of Siegel, Cooper & Co., a department store at the southeast corner of State and Van Buren Streets.4
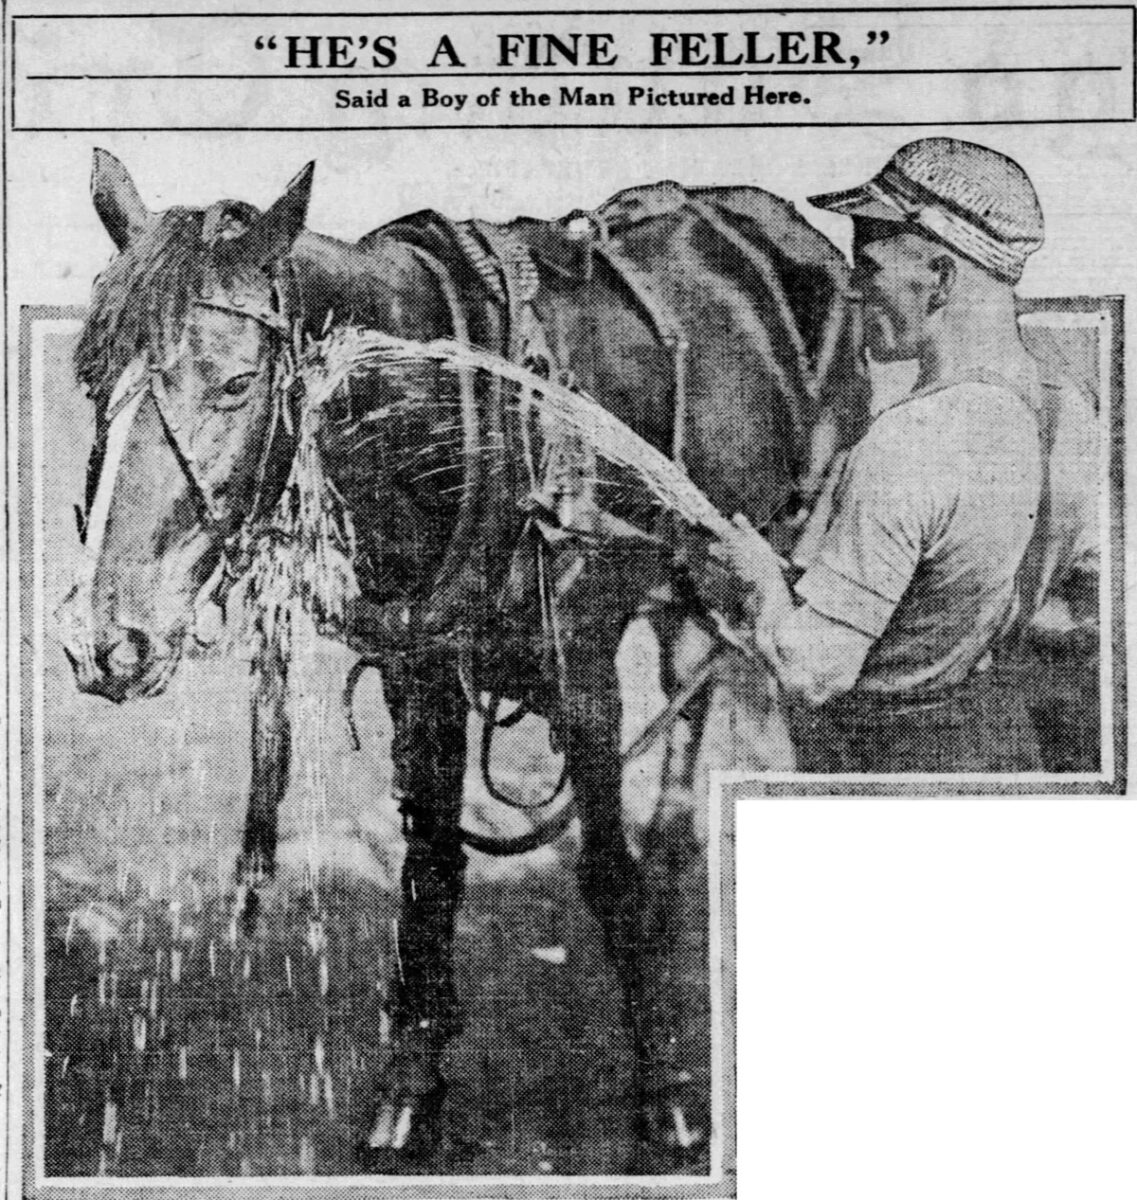
A THOUSAND HORSES DROPPED DEAD ON STREETS all across the city, officials reported. Health officials urged people not to make their horses move any faster than a walk. But wagon drivers said they still had to make their deliveries for their employers, giving them little chance to rest their horses.
“Certainly during this hot weather horses as well as human beings should be put upon half time,” the Chicago Department of Health remarked in its weekly bulletin. “Horse flesh is valuable. Conserve these useful agents of transportation. You do not have to feel sorry for an automobile; but for the horse stricken down in the street because it has been overworked and overdriven, there is the sympathy element.”47
A fire station in the Loop—Engine Company No. 13, at Dearborn and Lake Streets—set up an “improvised shower bath” for horses. The firemen stood outside the station with their hoses at the ready, offering to spray water at any horses being driven down the streets.48
As hundreds of horses succumbed to the heat, many were left lying in the streets for days, reportedly because teamsters were on strike against the Canal Melting Company, which had a contract with the city to remove and render animal carcasses.
“A stench so sickening that it caused people to walk blocks out of their way hit the West Side today,” the Day Book newspaper reported. “It came from the bodies of dead horses which littered the streets so thickly as to remind one of a field in the wake of a battle. It is estimated that 500 horses dropped dead with the heat within the past few days. The bodies of most of these are still lying where they fell—feasts for flies and vermin.”49
It wasn’t unusual for horses to die in Chicago’s streets during that era. In the end, the total number removed in 1916 was 8,031—an increase of just 162 compared with the previous year.50
Newspapers reported that dogs were dying in the heat as well.33 By the end of 1916, the total number of dead dogs taken from Chicago’s streets reached 15,132—a 15 percent increase over the prior year.50
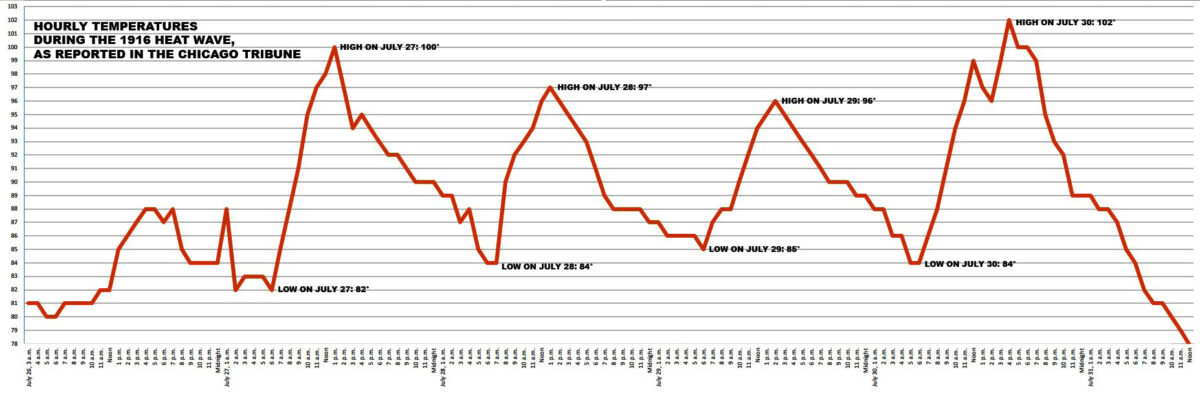
ON SATURDAY, JULY 29, CHICAGO ONCE AGAIN SET A NEW RECORD for the highest minimum temperature the city had ever experienced. The temperature inched down to 85 degrees at 6 a.m., and then it started climbing again, heading to a high of 96.
On Sunday, July 30, the city recorded yet another remarkably warm low temperature: 84 degrees at 6 a.m. And then the temperature climbed over the next 10 hours.
The wind shifted directions, blowing five miles an hour from the southwest.3 According to the Tribune, it “brought that stifling furnace breath from the plains and the Mississippi valley.”51 At 4 p.m., the temperature peaked at 102 degrees—or to be more precise, 101.7.
Sunday was the 10th consecutive day with 100 percent sunshine, breaking Chicago’s all-time record—a record that had been set just a few weeks earlier. July 1916 was the sunniest month Chicago meteorologists had ever recorded, with the sun shining during 95 percent of all daylight hours. Twenty-four days during that July had 100 percent sunshine.3
During this stretch of hot days, the relative humidity ranged from 54 to 66 percent. The heat index—which today’s meteorologists use as a way of measuring “how hot it really feels”—may have gone as high as 129, according to the National Weather Service’s Heat Index Calculator. But the heat index describes what it feels like in the shade. According to the weather service, it might feel as much as 15 degrees hotter in exposure to full sunshine.
WGN meteorologist Tom Skilling calculated that the heat index probably peaked at 115 to 120 degrees during the hottest days of the 1916 heat wave, staying between 90 and 95 at night. “The heat and humidity were stifling, exacerbated by cloudless skies that allowed unrelenting sunshine to bake the city,” Skilling wrote in 2006.52
REMARKABLY, THE CHICAGO WHITE SOX PLAYED EVERY DAY during the heat wave’s worst stretch—playing doubleheaders on back-to-back days that weekend, and winning all four of those games against the Philadelphia Athletics. White Sox owner Charles Comiskey allowed the “brave bleacherites” who were sitting under the sun’s glare to switch seats, moving over to shaded spots under the pavilion.53
The Chicago Fire Department opened hydrants and sprayed water at hot pavement and the sides of brick buildings in various neighborhoods, including Back of the Yards; the West Side’s immigrant “ghetto” along Halsted Street; and the Wicker Park-Bucktown area around North Avenue, Milwaukee Avenue, and Robey Street (now Damen Avenue). Children and grownups joyfully jumped into the sprays of water.
“I sure do feel sorry for the people in the crowded districts,” Fire Chief Thomas O’Connor remarked, “and if we can help them I’m ready to go to the limit.”54
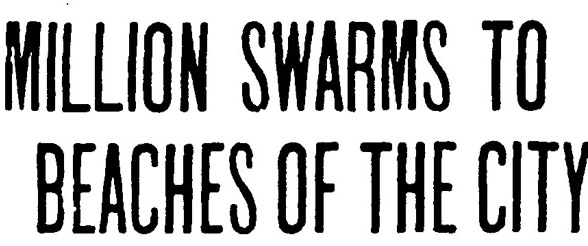
People waited in line for hours to get onto Chicago’s crowded beaches. According to one estimate, 180,000 people went to the beaches during the course of a single day.51 On another day during the heat wave, the Daily News reported that a million people—nearly half the city’s population—had flocked to the lakefront.
Clarendon Avenue Beach, Chicago 1916 pic.twitter.com/jSxLxbIkS2
— Jeff Nichols (@backwards_river) August 3, 2020
“The streets leading to the beach were filled with streams of people, staggering, perspiring, panting,” the newspaper reported. “They looked half dead, refugees from the heat. Automobiles loaded beyond capacity with men and women dressed for the water, flitted over the boulevards.”55
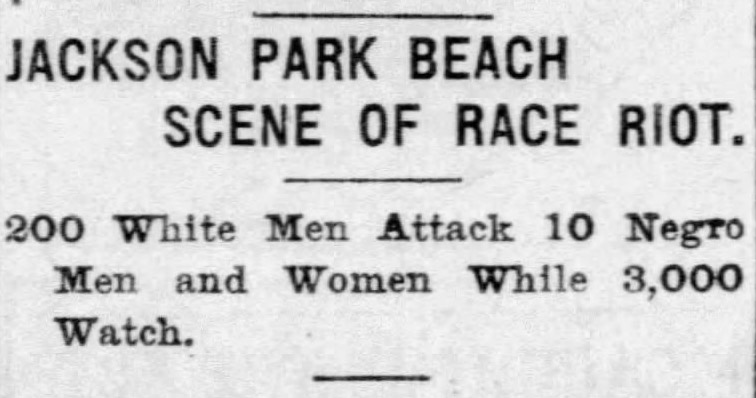
A “RACE RIOT” BROKE OUT AT A BEACH IN JACKSON PARK—a foreshadowing of the violence that would erupt three years later on another South Side beach, sparking Chicago’s deadly race riot of 1919 (which I wrote about for Chicago magazine.)
According to the Tribune, 200 white men fought with five Black men and five Black women at the beach on that Saturday. “One of the Negroes, it is said, made an insulting remark to one of the white men who was passing,” the Tribune reported, adding that the police arrested two Black men and one white man.56
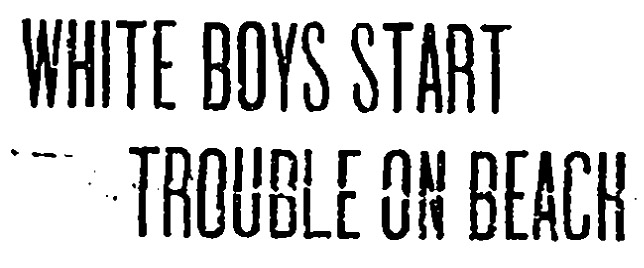
The Chicago Defender, the city’s leading Black newspaper, told a much different story about events in Jackson Park, reporting that two Black youths, Roy Moss and Robert Anderson, were in the water at 8 p.m. on that Saturday, June 29.
“The boys were innocently playing around in the water when a number of white boys began to throw water upon them,” the Defender wrote. “Our boys threw water back and all came out of the water. The white boys began throwing rocks. This caused some excitement. The police came and merely told the white boys, who were the aggressors, to move on, and the police did nothing to protect Moss or Anderson. …
“All the participants were interviewed and they said it was an uncalled for attack of the white boys to create disturbance. They have doing this ever since the hot weather; their aim being to keep our young people from enjoying the beach at various places and confining them to a certain district.”57
A day after the disturbance in Jackson Park, “the police were compelled to use harsh measures to force the Negroes from the beaches,” the Tribune reported. “In the morning several attacks were made on Negroes, who defied white bathers’ orders to leave. One Negro was badly beaten. White bathers, however, insisted they would take no chances on the possibilities of more insults to women, as alleged to have been made by Negroes the previous day.”58
The Defender commented: “It must be borne in mind that our people pay taxes for the use of the beach and must use it at any time. … Since there seems to be concerted action on part of some of the lower class of whites to intimidate, humiliate and cause disturbances with a view of making bad sentiment against us, it is our duty to resent this and see that every right guaranteed us at the beach is enjoyed. The time is ripe to put a stop to this and see that it does not occur at any of the public beaches.”57
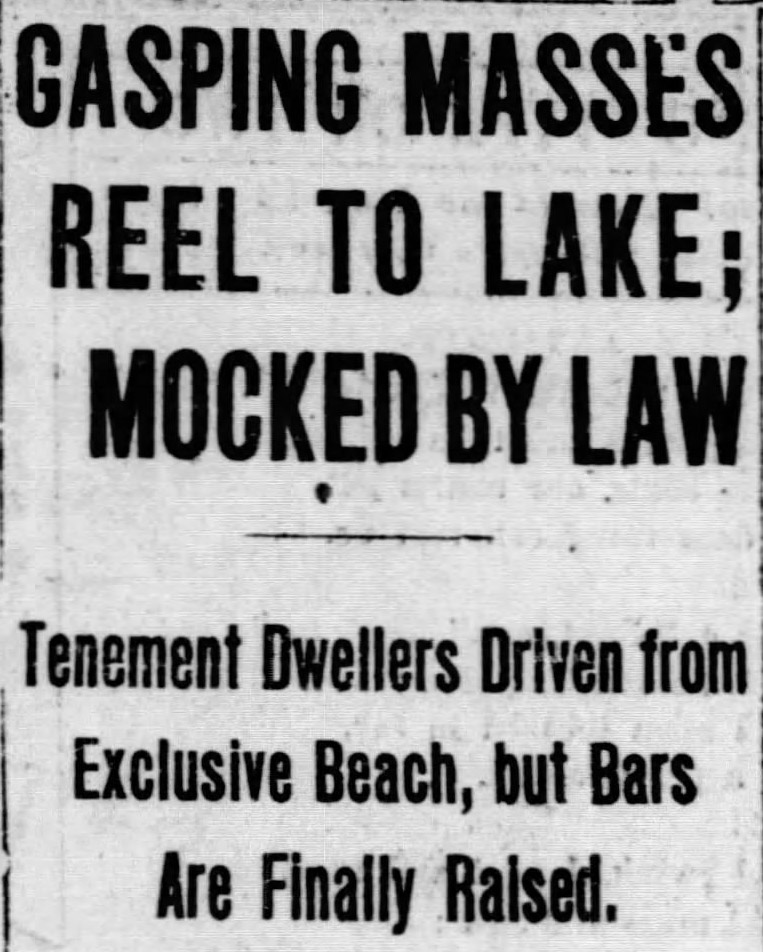
Meanwhile, on the city’s North Side, the Lincoln Park Commission tried to limit swimming hours at Oak Street Beach, where the wealthy residents of nearby mansions often complained about the crowds of bathers.59 But according to the Tribune, park officials gave in to the clamor from “tenement dwellers” who wanted to swim. They “passed a rule that people in the neighborhood, if properly attired, might have a dip in the lake between 5 and 7 a.m.”
Sometime after 7 a.m., a police officer in a white rowboat ordered hundreds of swimmers to get out of the lake, shouting: “Out of here! Out of here!” Some children in the water yelled back: “Tip him out!” “Tell him to go to hell!” “This is a free country!” The swimmers prevailed.60

Some of Chicago’s park commissions enforced an 11 p.m. curfew, arresting people who tried to sleep in parks.61 But as the heat wave continued, authorities grew more lenient.48
Officials estimated that 50,000 people spent the night in parks,21 including 8,000 to 10,000 in Grant Park, the lawn between downtown Chicago and Lake Michigan.62 Apparently, it wasn’t that unusual for people to spent the night in Grant Park—the Daily News called it “Chicago’s traditional open hotel for migrants and wanderers.”
But it was remarkable to see sleeping bodies covering practically the entire park, leaving little space for people to walk in between. Occasionally, someone would get up and try moving closer to the lake, in the hope of catching a breeze.
“Thousands of Grant Park’s guests for the night were ‘down and outers’ from the barrel houses of South State and Clark street, which emptied earlier than usual,” the Daily News reported. “Sprinkled among them were others who left their hotels in disgust and sought rest under the sky.”
Across the city, families slept on fire escapes and roofs, or on the ground between the streets and sidewalks.63 Even amid Drexel Boulevard’s mansions in the Kenwood neighborhood, the well-to-do residents “rushed out on to their lawns in bathrobes and rolled up for the night,” the Tribune reported.62
THE HEAT WAVE RELENTED ON THAT MONDAY, JULY 31, when the temperature finally dipped below 80 after 10 a.m. The wind changed direction and picked up a bit of speed, blowing 16 miles an hour from the north. And the temperature stayed in the 70s for the rest of the day.3
The worst of the heat was over. And yet, people continued dying from the effects of the heat wave. Over the next four days, city health officials counted 163 deaths from heat prostrations and 111 from diarrhea.35
Chicago wasn’t quite as hot, but temperatures remained above normal. It had been the hottest July meteorologists had ever recorded in Chicago up until that time, with temperatures averaging six degrees above normal. And the following month was the warmest August in Chicago history at that time. Another stretch of days—August 19, 20, and 21—had low temperatures of 80 degrees or higher.3
And the summer’s death toll kept rising.64
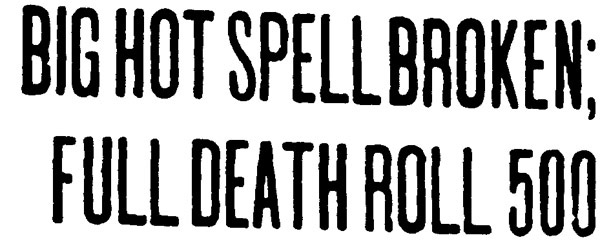
HOW MANY PEOPLE DID THE 1916 HEAT WAVE KILL? The answer to that question depends on how you define the time period of the heat wave: Was it several days at the end of July? Or did the heat wave extend across much of July and August?
The Chicago Department of Health tallied 535 deaths from heat during that year—ranging from July 16 through September 16. That was far higher than Chicago’s deaths tolls from heat-related causes in other years during the early 20th century. In other years between 1904 and 1922, the average number of heat-related deaths was 26. The second-highest death toll was in 1913, when heat caused 79 deaths.
If we define the 1916 heat wave with a narrower time frame, the city recorded 363 deaths during a two-week period including the worst of the heat.
But those numbers don’t include deaths indirectly caused by the heat. In July and August 1916, diarrhea and enteritis killed 1,191 children under 2 years old. That was 533 more than the infant death toll for those same illnesses in July and August 1915.
The heat wave hit Chicago’s immigrants especially hard. Immigrants were roughly a third of the city’s population—somewhere between the 35.7 percent reported by the 1910 census and the 29.8 percent reported by the 1920 census. But immigrants were 68 percent of those who died from heat. (Some of that discrepancy might be caused by differences in how local officials and the U.S. Census Bureau identified people.)
The data for infants who died in 1916 from diarrhea and enteritis show a similar pattern: 82 percent were children of immigrants.
The Chicagoans who died from heat were overwhelmingly male—85 percent were men and boys. Perhaps that’s because men were more likely to be doing manual labor during the heat wave. Two-thirds of the victims were men between 30 and 60 years old. And the mortality rate increased across the age spectrum for people over 5 years old.
| Age group | Deaths from heat in 1916 | Deaths per 100,000 people |
| Under 1 | 23 | 48.63 |
| Under 5 | 28 | 11.12 |
| 5 to 9 | 3 | 1.26 |
| 10 to 19 | 2 | 0.51 |
| 20 to 29 | 36 | 6.68 |
| 30 to 39 | 123 | 26.63 |
| 40 to 49 | 123 | 39.74 |
| 50 to 59 | 116 | 57.40 |
| 60 to 69 | 52 | 53.32 |
| 70 to 79 | 36 | 103.93 |
| 80 to 89 | 36 | 205.40 |
| 90 to 99 | 0 | 0 |
| 100 and over | 0 | 0 |
To calculate the death rate, the 1920 census total for each age group was used, adjusting for the 8 percent in population growth that Chicago experienced between 1916 and 1920, according to U.S. Census Bureau estimates.
One question is why the heat wave’s official death toll was so low for Black Chicagoans. Out of those 535 deaths from heat-related causes, only 10 people—or 1.87 percent—were Black.
Chicago’s population was at least 2 percent Black, as documented in the 1910 U.S. census. The percentage was almost certainly higher by 1916. Millions of African Americans were moving north during that decade, in the early years of the Great Migration. By 1920, Chicago’s population would be 4.1 percent Black.65
Were the deaths of Black people in the 1916 heat wave undercounted or misdiagnosed? Or is there another explanation for why that number is so low?
In their American Journal of the Medical Sciences article, Gauss and Meyer seemed surprised that even one Black patient had died of heat-related causes at Cook County Hospital. “One of the American-born patients was a negro, who died several hours after admittance,” they wrote. “This is interesting in view of the often expressed view that negroes possess a special immunity against the effects of heat.”34
Gauss and Meyer were referring to an old myth: the notion that African Americans had a special physical trait protecting them from the effects of hot weather. Before the Civil War, some Southern doctors had used this claim to justify forcing enslaved Black people to work in extreme heat. One physician said that an African American was “protected by the very nature of his constitution from the unhealthiness of hot climates.”66 In 2019, a headline in the New York Times called this theory one of the “Myths about physical racial differences were used to justify slavery — and are still believed by doctors today.”67
Are there any physiological differences in how people of different races react to heat? A study by the U.S. Army looked at heat illness hospitalizations and deaths for soldiers between 1980 through 2002, concluding: “African Americans and Hispanic Americans are less likely than Caucasians to be hospitalized for heat illness.” But the study also noted: “Recruits from northern states are more susceptible to heat illness than recruits from southern states. … Being unacclimatized to hot weather has been identified as an important factor in heat intolerance and heat illness.”68 Many of the Black people living in Chicago in 1916 had come from the South. Is it possible they were simply more accustomed to hot weather?
Research has shown that African Americans and other people of color are especially vulnerable during heat waves. In Chicago’s 1995 heat wave, “African Americans had the highest proportional death rates of any ethnoracial group,” Klinenberg wrote in Heat Wave. “They were significantly more vulnerable to the catastrophe than whites…”69
ANOTHER WAY OF LOOKING AT THE 1916 DATA IS EXCESS MORTALITY. This method was used in 1995, when there was debate over the death toll for that year’s heat wave. The Cook County coroner counted 465 heat-related deaths in the week of July 14–20, 1995, or 521 deaths during the month. But epidemiologist Steven Whitman noticed an increase in other deaths in Chicago during the same time period. He calculated that the number of “excess deaths” was 739.70
What can we learn from looking at the excess mortality in 1916?
The total number of people who died in Chicago that July and August—of all causes—was 6,388. Comparing that number with the death tolls for those months in 1914, 1915, 1917, and 1918 (and adjusting for population growth) shows an excess mortality of 1,119 people.
In other words, the death toll for those two hot months was 1,119 higher than you’d expect based on the pattern across those five years.
| Year | July-August deaths | Population | Deaths per 100,000 |
| 1914 | 5,383 | 2,397,600 | 224.5 |
| 1915 | 4,963 | 2,447,845 | 202.7 |
| 1916 | 6,388 | 2,497,722 | 255.7 |
| 1917 | 5,526 | 2,547,201 | 216.9 |
| 1918 | 4,849 | 2,596,681 | 186.7 |
207.7 was the average rate of deaths per 100,000 people in July and August of 1914, 1915, 1917, and 1918.
The rate was 48.0 percentage points higher for July and August 1916 than the average for the other four years.
Apply that rate of 48.0 to Chicago’s estimated population in 1916. The result indicates that the excess deaths in July-August 1916 were 1,199.71
What were some of the other causes of death pushing up the city’s death toll for July August? For one thing, the heat wave coincided with the first major outbreak of infantile paralysis, or polio, that Chicago had ever experienced.
The disease struck in Chicago in mid-July, just as the hot weather arrived—and about six weeks after a polio epidemic hit New York City. Over the next four months, 254 polio cases and 34 deaths were reported in Chicago, as local doctors studied the malady and tried to learn what caused it.71 As a later study noted, “the disease tends to flourish in warm weather.”73
In July and August 1916, heart disease claimed the lives of 652 Chicagoans—an increase of 146 (or 29 percent) over the heart disease deaths in July and August 1915.
Meanwhile, 51 people died in homicides during those months in 1916—an increase of 25 over the previous year.
The city did not release drowning statistics for those months, but the annual total was 130 accidental drownings, close to the average for that era. In July and August, 371 people died in accidents, including drownings and various other causes—an increase of 62 (or 20 percent) over July and August 191565 According to newspaper reports, those accidental deaths included at least two people who fell from window ledges while trying to cool off during the hot weather.74
City health officials eventually suggested that the heat wave’s death toll was comparable to the number of “excess deaths” in 1916 from sunstroke, heat exhaustion, diarrhea, and enteritis—in other words, the increase in the death tolls from those causes between 1915 and 1916. That number was 1,381. The Chicago Department of Health mentioned this momentous fact in a weekly department bulletin issued in October 1917.64
Viewed from a regional perspective, the heat wave had an even higher death toll—killing an unknown number of people in the area surrounding Chicago. The Tribune and Daily News mentioned deaths in Joliet, Niles, and Aurora. In northwest Indiana, at least 13 people died in Gary and four in Hammond.75
However you define the parameters of the 1916 heat wave or the deaths it caused, it’s clear that it was a major catastrophe. Nearly eight decades later, when the 1995 heat wave made headlines, one epidemiologist remarked, “Such a big disaster has never happened in the history of Chicago.”76
As a matter of fact, it had.
Continue reading below for an appendix about CHICAGO MORTALITY TRENDS; an appendix on WEATHER RECORDS; and SOURCE NOTES.
Appendix 1: Chicago’s mortality trends
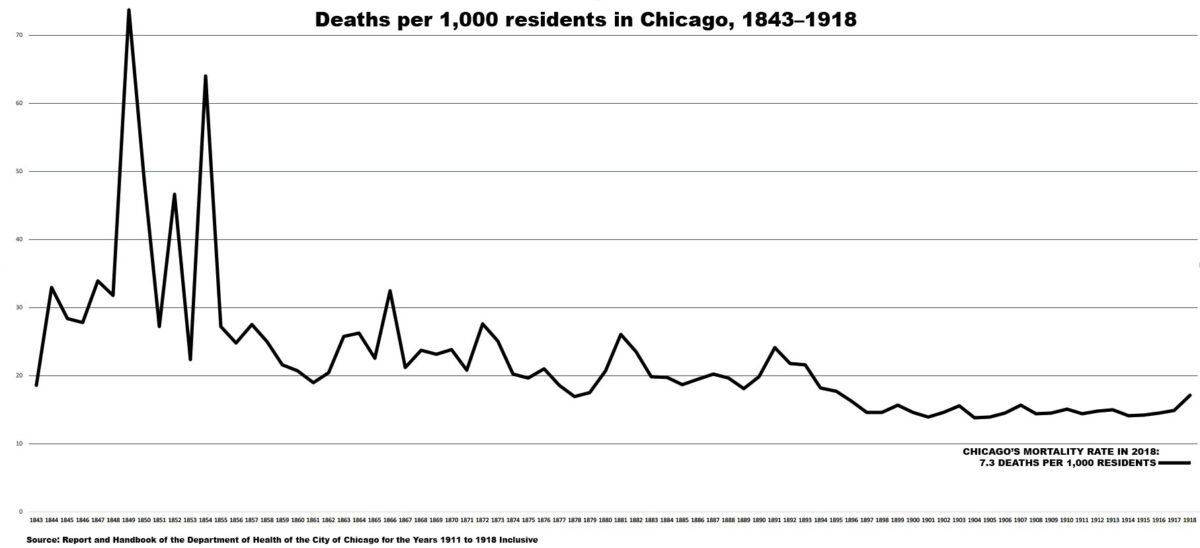
If you lived in Chicago in 1916, you were twice as likely to die at some point during the year than a Chicagoan would be in 2018. That’s how much the city’s mortality rate has fallen: from 14.5 deaths per 1,000 people in 1916 to 7.3 in 2018.
But in 1916, the city had already made huge strides in reducing the mortality rate from earlier times. Looking back to the 1850s, the average mortality in that decade was 33.6 deaths per 1,000 people. Or to put it another way, 1 out of every 30 people died in a typical year during the 1850s.77 By contrast, 1 out of every 138 Chicagoans died in 2018.78
As the mortality rate went down, life expectancy went up. In 1875, the average age of death in Chicago was 16. By 1905, it had increased to 31.79
In comparison, the life expectancy for Chicagoans in 2017 was 77 years—although studies have documented a 30-year gap between the life expectancies for people in the city’s poorest and wealthiest neighborhoods.80
The main reason why those historical numbers look staggeringly low by today’s standards? The high number of infant deaths. Nearly every year between 1868 and 1885, more than half of Chicago’s deaths were children under the age of 5.81
Of course, the low life expectancy didn’t mean it was impossible to reach a ripe old age. In 1890, for example, Chicago’s deaths included 52 people in their 90s and seven people who’d lived beyond their 100th birthday (or claimed to be that old, anyway).82 But that same year, when Chicago’s population surpassed 1 million, the city had only 22,471 people who were 65 or older—just 2 percent of the population.83
Chicago’s mortality rate began a dramatic decline around 1893. Modern researchers point to one major reason why Chicago became a less deadly place to live: improvements in the water supply.
In 1893, the city installed an intake crib four miles out into Lake Michigan, pulling in water that was cleaner than the polluted stuff along the shore. And in 1900, the Chicago River was reversed, sending its sewage-laden water flowing away from the lake, down a canal. As Chicago’s drinking water got cleaner, fewer people died from waterborne diseases.84
By 1915, Chicago’s mortality rate in had dropped to 14.3 deaths for every 1,000 residents. Infants under 1 year old accounted for 18 percent of all deaths, down from 30 percent in 1890. Children under 5 years old were 25 percent of all deaths, down from 45 percent in 1890.77
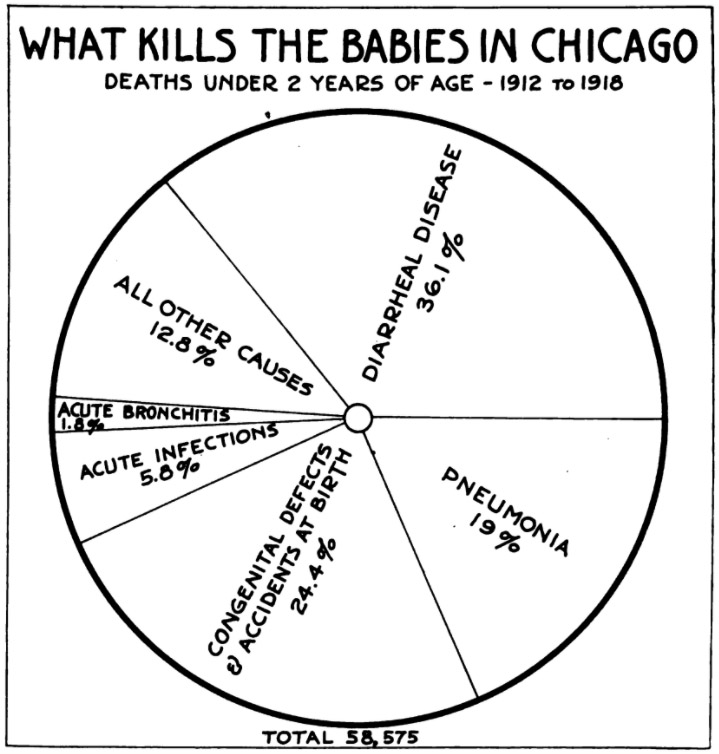
But in spite of the improvements in Chicago’s water, diarrheal diseases remained the leading cause of death for children under 2, claiming roughly 3,000 lives annually.85
Worldwide today, diarrheal disease is second-leading cause of death for young children, killing about 525,000 every year, according to the World Health Organization, which says many of those deaths could be prevented with safe drinking water and adequate sanitation and hygiene.86
In 1916, Chicago’s infant mortality rate—the number of infants under 1 year old who died for every 1,000 live births—was 14.5.87 In comparison, the city’s infant mortality rate in 2017 was 6.6.
However, there’s a wide disparity among racial groups: According to the Chicago Health Atlas website, 3.6 non-Hispanic white infants died out of every 1,000, but that number was 5.5 for Hispanic infants and 11.4 for non-Hispanic Black infants. In other words, Chicago’s Black children were three times more likely to die before their first birthday than white children.88
Appendix 2: Weather records
In many ways, the 1916 heat wave still ranks as one of the hottest stretches of weather Chicago has ever experienced.
Like the rest of the planet, Chicago has become warmer in the century since 1916. There’s a new normal.
Back in the early 20th century, 72.4 was considered the normal mean temperature for July in Chicago (based on weather records from 1873 through 1905). The National Weather Service now lists 74.0 as the normal for July in Chicago.
Meanwhile, Chicago’s normal temperature for August has increased from 71.2 to 72.4.89
Here’s where those hot days in July and August 1916 rank in the annals of Chicago weather history, according to the National Weather Service’s records.
These statistics cover from the time period from June 12, 1872, through July 29, 2020. They were generated by xmACIS2, the online Applied Climate Information System tool (a joint project of the Regional Climate Centers, the National Centers for Environmental Information, and the National Weather Service).
The only time Chicago has had consecutive days with a minimum temperature of 83 or higher: Three days—July 28–30, 1916
The only time has had consecutive days with a minimum temperature of 82 or higher: Four days—July 27–30, 1916
Days with the highest average temperature:
| 1. | 93.0 degrees | July 30, 1916 |
| 2. (tie) | 92.5 | July 6, 2012 July 13, 1995 |
| 4. | 92.0 | July 5, 1911 |
| 5. (tie) | 91.5 | July 14, 1995 July 24, 1934 Aug. 6, 1918 |
| 8. (tie) | 91.0 | July 5, 2012 June 20, 1953 July 10, 1936 July 27, 1916 |
| 12. (tie) | 90.5 | July 4, 2012 July 29, 1916 July 28, 1916 |
| 15. (tie) | 90.0 | July 24, 2005 July 15, 1980 July 4, 1911 July 21, 1901 |
| 19. (tie) | 89.5 | Aug. 1, 2006 July 30, 1999 Aug. 2, 1988 July 27, 1955 July 24, 1940 Aug. 21, 1916 |
July with the hottest average temperature:
| 1. | 81.3 degrees | 1955 |
| 2. | 81.2 | 1921 |
| 3. | 81.1 | 2012 |
| 4. | 79.0 | 2011 |
| 5. (tie) | 78.5 | 1977 1916 |
August with the hottest average temperature:
| 1. | 80.2 degrees | 1947 |
| 2. | 79.0 | 1995 |
| 3. (tie) | 78.7 | 1959 1955 |
| 4. | 77.3 | 1983 |
| 5. | 76.8 | 1988 |
| 6. (tie) | 76.7 | 2010 1973 1916 |
Highest average temperature for a four-day period:
| 1. | 91.3 degrees | July 27–30, 1916 |
| 2. | 90.1 | July 3–6, 2012 |
| 3. (tie) | 89.9 | July 4–7, 2012 July 2–5, 1911 |
| 5. (tie) | 89.1 | July 28–31, 1916 July 26–29, 1916 |
Highest average temperature for a five-day period. Note that the several of the following lists include overlapping time periods.
| 1. | 89.9 degrees | July 26–30, 1916 |
| 2. | 89.5 | July 27–31, 1916 |
| 3. | 89.2 | July 3–7, 2012 |
| 4. (tie) | 89.0 | July 2–6, 2012 July 1–5, 1911 |
Highest average temperature for a six-day period:
| 1. | 88.7 degrees | July 26–31, 1916 |
| 2. | 88.4 | July 2–7, 2012 |
| 3. | 88.3 | July 25–30, 1916 |
| 4. (tie) | 87.4 | July 1–6, 2012 July 1–6, 1911 |
Highest average temperature for a seven-day period:
| 1. | 87.9 degrees | July 24–30, 1916 |
| 2. | 87.5 | July 23–31, 1916 |
| 3. | 87.1 | July 1–7, 2012 |
| 4. | 86.7 | July 2–8, 2012 |
| 5. | 86.6 | July 26–Aug. 1, 1916 |
Highest average temperature for a 14-day period:
| 1. | 84.4 degrees | July 25–Aug. 7, 1916 |
| 2. (tie) | 84.2 | July 26–Aug. 8, 1916 July 24–Aug. 6, 1916 |
| 4. | 83.9 | July 22–Aug. 4, 1916 |
| 5. | 83.8 | July 18–31, 1916 |
| 6. | 83.8 | July 23–Aug. 5, 1916 |
| 7. | 83.7 | July 21–Aug. 3, 1916 |
| 8. | 83.7 | July 27–Aug. 9, 1916 |
| 9. (tie) | 83.6 | July 25–Aug. 7, 1955 July 22–Aug. 4, 1955 |
Days with the highest minimum temperature. Remarkably, those three days at the end of July 1916 still hold the top three spots on this list—and five other days from July and August 1916 also rank among the 32 days in Chicago history with the highest low temperatures.
| 1. | 85 degrees | July 29, 1916 |
| 2. (tie) | 84.0 | July 30, 1916 July 28, 1916 |
| 4. | 83 | July 14, 1995 |
| 5. (tie) | 82.0 | July 6, 2012 July 15, 1980 Aug. 6, 1918 Aug. 21, 1916 Aug. 19, 1916 July 27, 1916 July 5, 1911 |
| 12. (tie) | 81.0 | July 19, 2019 July 23, 2012 July 13, 1995 June 28, 1913 |
| 16. (tie) | 80.0 | June 30, 2018 July 18, 2011 Aug. 1, 2006 Aug. 3, 1988 July 6, 1977 July 22, 1972 July 21, 1972 July 29, 1941 July 11, 1936 July 10, 1936 June 30, 1931 June 29, 1931 July 4, 1921 Aug. 20, 1916 July 26, 1916 |
Days with the highest maximum temperature. At the time, July 30, 1916, ranked as the day with the second-highest temperature ever recorded in Chicago. It is now tied for 10th place.
| 1. | 105 degrees | July 24, 1934 |
| 2. (tie) | 104 | July 13, 1995 June 20, 1988 June 20, 1953 |
| 5. (tie) | 103 | July 6, 2012 July 5, 2012 June 25, 1988 July 1, 1956 July 21, 1901 |
| 10. (tie) | 102 | July 4, 2012 July 24, 2005 July 15, 1988 July 7, 1980 June 19, 1953 July 3, 1949 July 10, 1936 June 1, 1934 Aug. 5, 1918 July 30, 1916 July 5, 1911 July 4, 1911 July 10, 1901 |
Consecutive days with a minimum temperature of 80 or higher:
| 1. | Five days | July 26–30, 1916 |
| 2. | Three days | Aug. 19–21, 1916 |
| 3. (tie) | Two days | July 13–14, 1995 July 21–22, 1972 July 10–11, 1936 June 29–30, 1931 July 16–17, 1878 |
Consecutive days with an average temperature of 89 or higher:
| 1. | Four days | July 27–30, 1916 |
| 2. (tie) | Three days | July 4–6, 2012 July 3–5, 1911 |
| 4. (tie) | Two days | July 13–14, 1995 Aug. 1–2, 1988 Aug. 6–7, 1918 |
Consecutive days with an average temperature of 90 or higher:
| 1. | Four days | July 27–30, 1916 |
| 2. | Three days | July 4–6, 2012 |
| 3. (tie) | Two days | July 13–14, 1995 July 4–5, 1911 |
Consecutive days with a maximum temperature of 96 or higher:
| 1. | Nine days | Aug. 26–Sept. 3, 1953 |
| 2. | Six days | July 2–7, 2012 |
| 3. (tie) | Five days | July 5-9, 1988 July 1–5, 1911 |
| 5. (tie) | Four days | July 12-15, 1995 Aug. 1–4, 1988 June 27–30, 1971 Aug. 17–20, 1947 July 22–25, 1940 July 27–30, 1916 |
Source notes
1 “Little Stories of the Record Heat Wave,” Chicago Daily News, July 29, 1916.
2 “Alcohol Blamed for 98 Per Cent of Heat Strokes,” Chicago Daily Tribune, Aug. 23, 1916.
3 The weather data in this story come from these sources: C.L. Mitchell, U.S. Department of Agriculture, Weather Bureau, “Monthly Meteorological Summary with Comparative Data, Chicago, Ill., July, 1916”; Henry J. Cox, U.S. Department of Agriculture, Weather Bureau, “Monthly Meteorological Summary with Comparative Data, Chicago, Ill., August, 1916”; “The Weather,” Chicago Daily Tribune, July 28–31, 1916; and the Applied Climate Information System, accessed July 24, 2020.
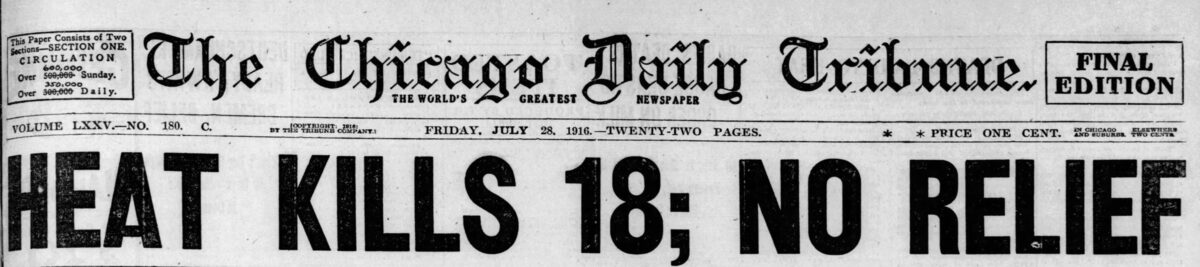
4 “Heat Kills 18; No Relief,” Chicago Daily Tribune, July 28, 1916.
5 “Mercury Reaches 100; Relief in Lake Breeze,” Chicago Daily News, July 27, 1916.
6 “Six Bathers Lose Lives; Heat Kills 2,” Chicago Daily Tribune, July 17, 1916.
7 Bulletin, Chicago School of Sanitary Instruction 10, no. 31 (July 29, 1916), 162.
8 John Dill Robertson, Report and Handbook of the Department of Health of the City of Chicago for the Years 1911 to 1918 Inclusive (Chicago: House of Severinghaus, 1919), 1312.
9“Read Nature in Hot Weather,” Chicago Daily Tribune, July 25, 1916.
10 Amanda Green, “The Cool History of the Air Conditioner,” Popular Mechanics, Jan. 1, 2015.
11 Dominic A. Pacyga, Slaughterhouse: Chicago’s Union Stock Yard and the World It Made (Chicago: University of Chicago Press, 2015), 14.
12 Charles N. Wheeler, “End of Hot Wave Near,” Chicago Daily Tribune, July 29, 1916; Bernard Nagengast, “Early Twentieth Century Air-Conditioning Engineering,” ASHRAE Journal, March 1999, 58.
13 Bulletin, Chicago School of Sanitary Instruction 10, no. 32 (Aug. 5, 1916), 166.
14 Sharon DeBartolo Carmack, “History of the Electric Fan,” Family Tree Magazine, accessed July 20, 2020.
15 Advertisement, Chicago Daily Tribune, July 19, 1916.
16 Harold L. Platt, The Electric City: Energy and the Growth of the Chicago Area, 1880–1930 (Chicago: University of Chicago Press, 1991), 161-162.
17 Ralph and Terry Kovel, “Non-Electric Fans Used Alcohol or Gas,” Cowles Syndicate Inc., Chicago Tribune, June 17, 1994.
18 Advertisement, Chicago Daily News, July 28, 1916.
19 “Hot Weather Don’ts in Caring for Baby,” Chicago Defender, Aug. 5, 1916.
20 Robertson, Report … for the Years 1911 to 1918 …, 981-983.
21 “Heat Death Roll Vast; Sweeping Ice Orders,” Chicago Daily News, July 29, 1916.
22 “Small Ice Dealers Plan to Get Action Against Consumers Co.,” Day Book, Aug. 11, 1916.
23 “44 Babies Die in 24 Hours; Record Broken,” Chicago Daily Tribune, July 30, 1916.
24 “Rain Breaks Fatal Heat; Day’s Toll Five,” Chicago Daily Tribune, July 25, 1916.
25 “Six Bathers Lose Lives; Heat Kills 2,” Chicago Daily Tribune, July 17, 1916; “Rain Breaks Fatal Heat; Day’s Toll Five,” Chicago Daily Tribune, July 25, 1916; “Mercury Reaches 100; Relief in Lake Breeze,” Chicago Daily News, July 27, 1916.
16 My calculation based on Chicago Department of Health annual reports. Accidental drowning totals are not available for 1910 and 1911; suicidal drowning totals are not available for 1907 through 1911.
27 Great Lakes Surf Rescue Project, “Statistics,” accessed July 21, 2020.
28 Brr! But It Is Cold!—No, Not in Chicago—In Nevada! Our Town Still Melts,” Chicago Daily Tribune, July 28, 1916.
29 “How’d You Like to Be the Ice Man?—A Pleasant Idea,” Day Book, July 27, 1916; David Garrard Lowe, “Public Buildings in the Loop,” Encyclopedia of Chicago; Larry J. Homolka and William J. Rudd, “Photographs, Written Historical and Descriptive Data—United States Post Office, Customs House and Sub-Treasury, Chicago, Illinois,” Historic American Buildings Survey, National Park Service, July 1964.
30 “How’d You Like to Be the Ice Man?—A Pleasant Idea,” Day Book, July 27, 1916.
31 “Deaths by Heat Yesterday,” Chicago Daily Tribune, July 29, 1916.
32 “Deaths Laid to Heat,” Chicago Daily Tribune, July 28, 1916.
33 “It Is Getting No Cooler,” Chicago Daily Tribune, July 26, 1916.
34 H. Gauss and K.A. Meyer, “Heat Stroke: Report of One Hundred and Fifty-Eight Cases from Cook County Hospital, Chicago,” American Journal of the Medical Sciences 154 (1917): 554-564, doi:10.1097/00000441-191710000-00010.
35 Bulletin, Chicago School of Sanitary Instruction 10, no. 32 (Aug. 5, 1916), 163.
36 W.A. Evans, “Infant Mortality,” Chicago Daily Tribune, July 27, 1916.
37 “Watch the Baby in This Weather, Doctors Warn,” Chicago Daily Tribune, July 27, 1916
38 Jeff Nichols, “The Maverick at the Center of Chicago’s 1918 Flu Response,” Chicago Reader, May 12, 2020.
39 “Don’t Let Your Baby Die,” Chicago Daily News, July 27, 1916.
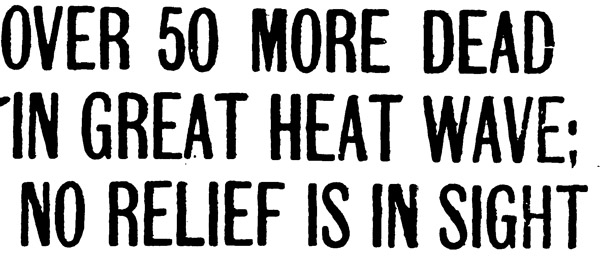
40 “Over 50 More Dead in Great Heat Wave; No Relief in Sight,” Chicago Daily News, July 28, 1916.
41 “50 Baby Deaths in Single Day Laid to Heat,” Chicago Daily Tribune, July 31, 1916.
42 Eric Klinenberg, Heat Wave: A Social Autopsy of Disaster in Chicago, Second Edition (Chicago: University of Chicago Press, 2002, 2015), 32, 172, 175.
43 “Wage War on Baby Sirup,” Chicago Daily News, Aug. 4, 1916.
44 “The Heat Death List in Chicago,” Chicago Daily News, July 29, 1916.
45 “The Heat Death List in Chicago,” Chicago Daily News, July 29, 1916.
46 “Claim Heat Overcame Thirty Girls at the Fair,” Day Book, Aug. 1, 1916.
47 Bulletin, Chicago School of Sanitary Instruction 10, no. 32 (Aug. 5, 1916), 164-165.
48 Charles N. Wheeler, “End of Hot Wave Near,” Chicago Daily Tribune, July 29, 1916.
49 “Why Dead Horses Are Left Lying in Streets,” Day Book, Aug. 3, 1916; “Some Negligence in the Removal of Dead Horses,” Day Book, July 31, 1916.
50 Chicago, Forty-First Annual Report of the Department of Public Works for the Year Ending December 31, 1916 (Chicago: Cameron, Amberg & Co., 1917), 240; Chicago, Fortieth Annual Report of the Department of Public Works for the Year Ending December 31, 1915 (Chicago: Cameron, Amberg & Co., 1917), 268.
51 “Cool Wave Here Tonight,” Chicago Daily Tribune, July 31, 1916.
52 Tom Skilling, “July 30, 1916: 90th Anniversary of Chicago’s Hottest Day,” Chicago Tribune, July 30, 2006.
53 Baseball Reference; George S. Robbins, “Rowlanders Fight Hard for 3d Game,” Chicago Daily News, July 27, 1916; “Notes,” Chicago Daily Tribune, July 28, 1916.
54 “Cool Wave Now on Way,” Chicago Daily Tribune, July 30, 1916.
55 “Million Swarms to Beaches of City,” Chicago Daily News, July 29, 1916.
56 “Jackson Park Beach Scene of Race Riot,” Chicago Daily Tribune, July 30, 1916.
57 “White Boys Start Trouble on Beach,” Chicago Defender, Aug. 5, 1916.
58 “Mounted Police Called to Quell Riots at Beach,” Chicago Daily Tribune, July 31, 1916.
59 “Oak Street Beach,” Chicago Park District, accessed July 21, 2020.
60 Charles N. Wheeler, “Gasping Masses Reel to Lake; Mocked by Law,” Chicago Daily Tribune, July 31, 1916.
61 “Toasted Items Produced by the Hot Spell,” Chicago Daily Tribune, July 28, 1916.
62 “Fall Kills Aged Woman Seeking Cool at Window,” Chicago Daily Tribune, July 31, 1916.
63 “Pass Nights in Parks to Escape the Heat,” Chicago Daily News, July 28, 1916.
64 Bulletin, Chicago School of Sanitary Instruction 11, no. 41 (Oct. 6, 1917), 158.
65 Annual death figures: Robertson, Report … for the Years 1911 to 1918 …, 1318-1337; “Revised Mortality Figures, 1916-1915,” Bulletin, Chicago School of Sanitary Instruction 11, no. 41 (Oct. 6, 1917), 158, 160. July and August figures: Bulletin, Chicago School of Sanitary Instruction 10, no. 33 (Aug. 12, 1916), 169; and no. 37 (Sept. 9, 1916), 185. Historical trend: Annual Chicago Department of Health reports. U.S. Census Bureau data on immigrants, Blacks, and age groups in Chicago: 1910 Census Vol. 2, Population, Reports by States, with Statistics for Counties, Cities, and Other Civil Divisions, 504; 1920 Census Vol. 2, Population, General Report and Analytical Tables, Age Distribution Tables, 291; 1920 Census Vol. 3, Population, Composition and Characteristics of the Population by States, 248.
66 Alan Derickson, “‘A Widespread Superstition’: The Purported Invulnerability of Workers of Color to Occupational Heat Stress,” American Journal of Public Health 109 (2019): 1329-1335, https://doi.org/10.2105/AJPH.2019.305246.
67 Linda Villarosa, “Myths About Physical Racial Differences Were Used to Justify Slavery — and Are Still Believed by Doctors Today,” New York Times, Aug. 14, 2019.
68 Robert Carter III, et al, “Epidemiology of Hospitalizations and Deaths from Heat Illness in Soldiers,” Medicine & Science in Sports & Exercise 37, no. 8 (August 2005): 1338-1344, https://apps.dtic.mil/sti/citations/ADA443873.
69 Klinenberg, Heat Wave, 18-19.
70 Klinenberg, Heat Wave, 28-29.
71 Estimated annual population: Robertson, Report … for the Years 1911 to 1918 …, 1425; monthly death totals: 1426.
72 Robertson, Report … for the Years 1911 to 1918 …, 151-224.
73 Charles Armstrong, “Poliomyelitis: A Possible Relationship of Weather to the Gastrointestinal Route of Infection,” American Journal of Public Health and the Nation’s Health 51, no. 8 (August 1961): 1174-1181, https://ajph.aphapublications.org/doi/pdf/10.2105/AJPH.51.8.1174.
74 “Mercury Reaches 100; Relief in Lake Breeze,” Chicago Daily News, July 27, 1916; “Fall Kills Aged Woman Seeking Cool at Window,” Chicago Daily Tribune, July 31, 1916.
75 “Rain Breaks Fatal Heat; Day’s Toll Five,” Chicago Daily Tribune, July 25, 1916; “Deaths by Heat Yesterday,” “Four Dead Near Aurora,” and “28 Babies Dead in Gary,” Chicago Daily Tribune, July 29, 1916; “The Heat Death List in Chicago,” Chicago Daily News, July 29, 1916; “Gary Deaths Thirteen” and “Four Dead in Hammond,” Chicago Daily Tribune, July 30, 1916.
76 Klinenberg, Heat Wave, 203-204.
77 Robertson, Report … for the Years 1911 to 1918 …, 1425, 1428, 1430.
78 Illinois Department of Public Health, “Statewide Leading Causes of Death by Resident County, Illinois Residents, 2018″; U.S. Census Bureau, “Quick Facts: Chicago city, Illinois.”
79 Charles J. Whalen, Biennial Report of the Department of Heath of the City of Chicago for the Years 1904–1905 (Chicago: Cameron, Amberg & Co., 1906), unnumbered page before title page.
80 Chicago Health Atlas, “Life Expectancy,” accessed July 25, 2020; NYU Langone Health NewsHub, “Large Life Expectancy Gaps in U.S. Cities Linked to Racial & Ethnic Segregation by Neighborhood,” June 5, 2019; Lisa Schencker, “Chicago’s Lifespan Gap,” Chicago Tribune, June 6, 2019.
81 Annual Chicago Department of Health reports.
82 Chicago, Report of the Department of Health of the City of Chicago for the Year 1890 (Chicago: P.F. Pettibone & Co., 1891), 54.
83 U.S. Census Bureau, Eleventh Census Volume 1. (Part I & Part II) Report on Population of the United States, “Ages—Tables 3 (continued),” 117.
84 William T. Sedgwick and Allen Hazen, “Water-Related Epidemics,” Encyclopedia of Chicago; Joseph P. Ferrie and Werner Troesken, “Death and the City: Chicago’s Mortality Transition, 1850-1925,” National Bureau of Economic Research Working Paper 11427 (June 2005), 13, 39.
85 Whalen, Annual … 1906, 297; Robertson, Report … for the Years 1911 to 1918 …, 1402.
86 “Diarrhoeal disease,” World Health Organization, May 2, 2017.
87 Robertson, Report … for the Years 1911 to 1918 …, 1322, 1402.
88 Chicago Health Atlas, “Infant Mortality,” accessed July 25, 2020.
89 National Weather Service, “July Temperature Rankings for Chicago,” accessed July 22, 2020; National Weather Service, “August Temperature Rankings for Chicago,” accessed July 22, 2020; Robertson, Report … for the Years 1911 to 1918 …, 1457.